Sales, pricing, supply, and regulation through Q3 2026, with the outlook into 2027.
NYC multifamily sales reached $6.99 billion across 1,044 transactions through the first three quarters of 2026. Dollar volume fell in Q3 even as deal count rose, with fewer large trades closing.
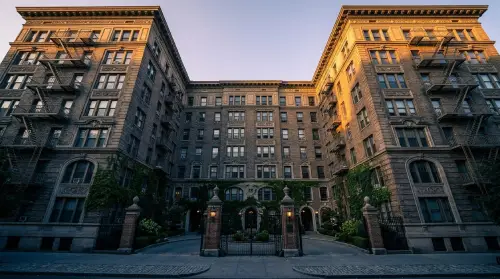
Pricing has split by asset type. Free-market Brooklyn sits at $552 per SF, while rent-stabilized Brooklyn trades at $137 per SF.
| Submarket | Dollar Volume | YoY | Transactions |
|---|---|---|---|
| Brooklyn | $693.8M | -12.8% | 178 |
| Manhattan (below 96th St.) | $685.2M | -43.6% | 58 |
| Bronx | $123.5M | -5.0% | 28 |
| Northern Manhattan | Not reported | +32.8% | 16 |
| Queens | Not reported | +26.9% | 62 |
Q3 figures include projected closings for the final 14 days of the quarter.
| Market | Asset Type | Per SF | Per Unit |
|---|---|---|---|
| Manhattan | Free market | $843 | $678,000 |
| Brooklyn | Free market | $552 | $509,000 |
| Manhattan (below 96th St.) | Rent stabilized | $356 | $156,000 |
| Queens | Rent stabilized | $193 | $155,000 |
| Northern Manhattan | Rent stabilized | $140 | Not reported |
| Brooklyn | Rent stabilized | $137 | Not reported |
Dollar volume by submarket reported
Trailing six months
| Property | Market | Price | Detail |
|---|---|---|---|
| Pinnacle portfolio | NYC | $449.0M | Chapter 11 sale, Q1 |
| 118 Hope Street (Casa Hope) | Williamsburg | $122.5M | 144 units, bought by Mann Group |
| 260 West 52nd Street | Manhattan | $103.9M | Partial-interest sale |
| 21 Brooklyn walk-ups | Brooklyn | $87.5M | Bought by Carlyle |
| 60 East 12th Street | Manhattan | $82.3M | About $601,000 per unit |
| 1920 Amsterdam Avenue | Manhattan | $80.0M | Affordable housing |
| PPSP portfolio | Flatbush | $79.9M | 387 units, affordable housing |
| Manhattan Valley Apartments | Upper West Side | $75.0M | 126 units, affordable housing, Q2 |
Brooklyn accounts for the largest share of 2026 apartment openings, while vacancy held at 2.51% in Q2.
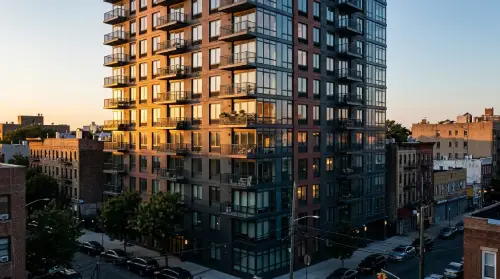
Opening counts cover buildings with 50 or more units. The metro total includes New Jersey cities and excludes the Bronx and Staten Island.
Full-year 2027 results do not exist yet. These are the known rules and published expectations shaping the year ahead.
In June 2026 the Rent Guidelines Board voted 7-1 for a 0% increase on one-year and two-year stabilized leases, for the guideline year through September 30, 2027.
Market participants anticipate a rebound in fourth-quarter sales volume after the Q3 pullback.
The construction pipeline has thinned from its early 2024 peak, which should help keep vacancy low.
NYC multifamily sales reached $6.99 billion across 1,044 transactions through the first three quarters of 2026, up 7.9% in dollar volume year over year.
Brooklyn led with $693.8 million, ahead of Manhattan below 96th Street at $685.2 million.
The Rent Guidelines Board approved a 0% increase on one-year and two-year stabilized leases for the guideline year through September 30, 2027.
Over the trailing six months, free-market Manhattan averaged $843 per SF and free-market Brooklyn $552 per SF, while rent-stabilized Brooklyn averaged $137 per SF.
Thinking about selling, buying, or valuing a multifamily building? Get a direct read on your asset.
718.751.0738
