Brooklyn neighborhoods, Manhattan townhouses, multifamily and commercial, updated with the latest 2026 data.
Every report covers prices, sales activity, supply, and what to watch into 2027. Update dates refresh automatically as each report changes.
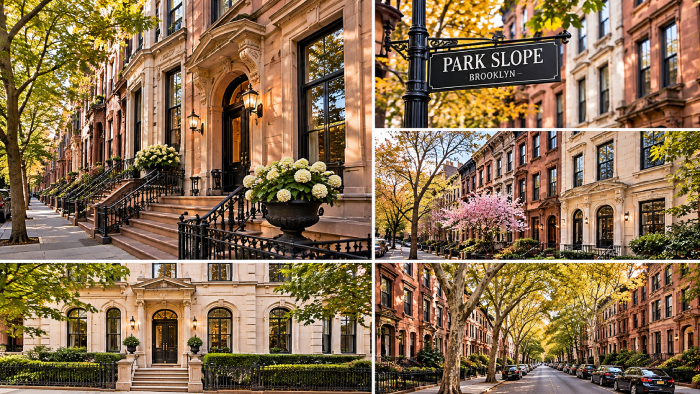 Market ReportPark Slope$1.7M
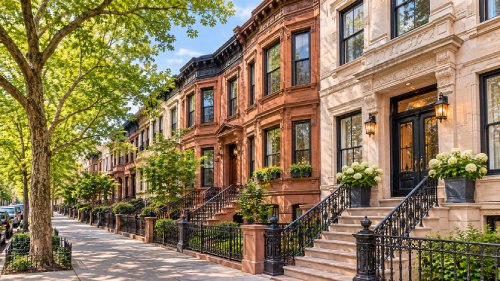 Market ReportBushwick$1.22M
 Market ReportCrown Heights$1.62M
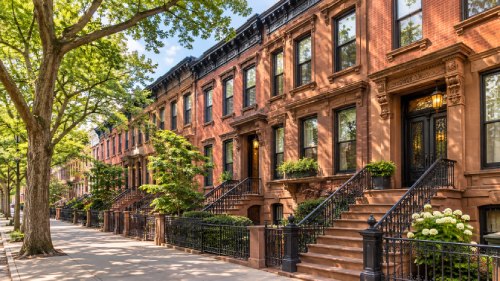 Market ReportBedford-Stuyvesant$1.3M
 Market ReportRemsen VillageNeighborhood intelligenceUpdated 2026Read the report
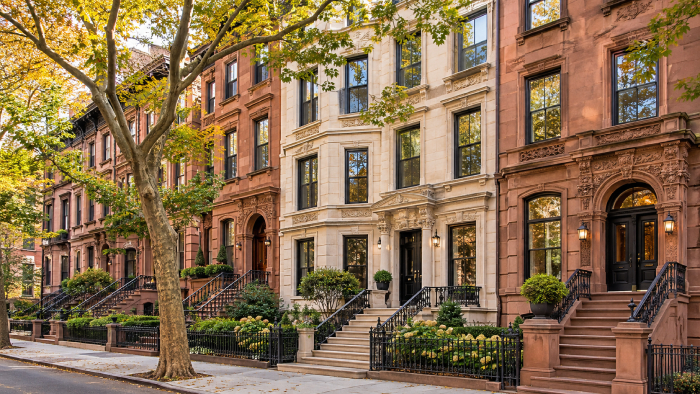 Market ReportManhattan TownhousesNeighborhood intelligenceUpdated 2026Read the report
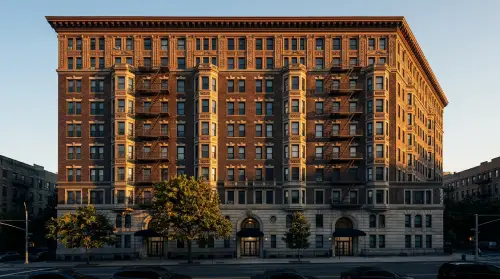 Market ReportNYC Multifamily$6.99B
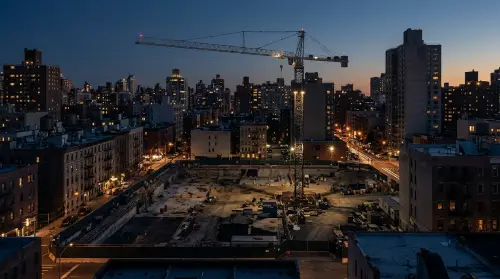 Market ReportNYC Commercial$23.69B
Q3 2026
Q3 2026 vs. Q3 2025
Q3 2026 median
Q3 2026 vs. Q3 2025
Across every tracked neighborhood, prices rose while the number of sales fell, a sign of tight supply heading into 2027.
Loading the latest articles...
Want to know what your building or home is worth in today's market? Request a private valuation.
718.751.0738
